- Home
- Air Quality
- Air Quality Data
- Data Summary
- 2020 Data Summary
2020 Data Summary
Air Quality Data Summary for 2020
Fine particles and smog (ozone) are our greatest concerns in Puget Sound. These types of air pollution cause heart attacks, strokes, and even premature death. Air pollution is especially dangerous for children, the elderly, and people with lung or heart diseases.
Since 2017, we have faced continually higher levels of wildfire smoke in the last three out of four years. In September of 2020, we recorded the highest ever fine particle levels since we started monitoring for them in 1999. Also, in the spring of 2020, due to the COVID-19 pandemic and stay-at-home orders, a lot of people were at home, which led to higher-than-expected wood smoke compared to past spring seasons. However, we also saw less traffic in the spring in 2020 due to less commuting and other trips during the COVID-19 pandemic.
Overall, most days were in the GOOD air quality category with some MODERATE days; however, we also observed days that were UNHEALTHY FOR SENSITIVE GROUPS, UNHEALTHY, and VERY UNHEALTHY. The table below shows the air quality health categories over 2020 by county.
2020 Air Quality, Days by Health Category
| County | Good | Moderate | Unhealthy for Sensitive Group | Unhealthy | Very Unhealthy |
| King | 296 days | 55 days | 6 days | 4 days | 4 days |
| Kitsap | 344 days | 12 days | 3 days | 3 days | 3 days |
| Pierce | 295 days | 59 days | 4 days | 4 days | 3 days |
| Snohomish | 292 days | 63 days | 3 days | 6 days | 1 day |
Fine particles
Fine particles are tiny, microscopic pieces of pollution which are even smaller than a hair. These can easily enter the deepest part of your lungs and cause breathing and heart problems. In our region, they mainly come from wood smoke from home heating, vehicles, wildfires, and industry.
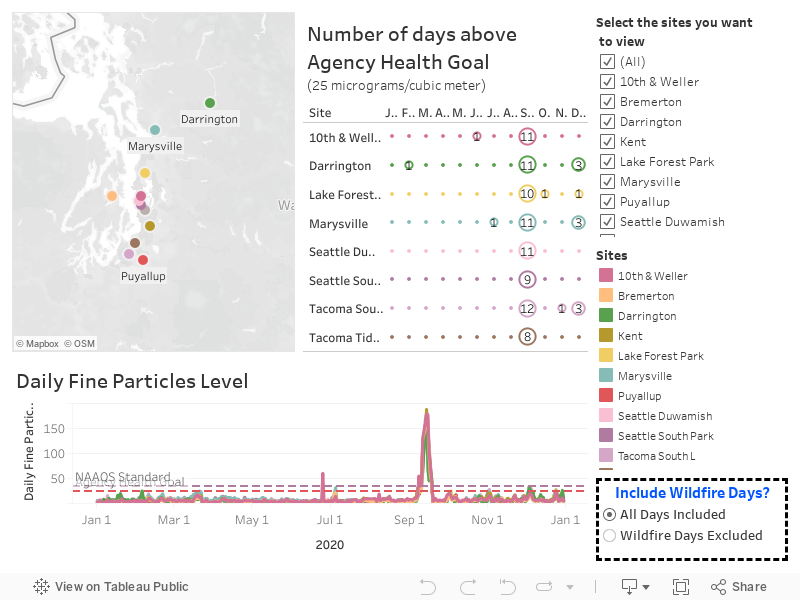
The graph below shows that all the sites had fine particle levels within the EPA standard (of 35 micrograms per cubic meter) on most days in 2020, except for the wildfire smoke days. Wildfire smoke impacted the air quality at all sites and led to harmful levels on 12 days in September (9/8/20 – 9/18/20). The graph below shows daily fine particles level for all days in 2020; wildfire excluded days can be viewed by selecting the Wildfire Days Excluded option on the right side of the graph under the section Include Wildfire Days?. Wildfire smoke is considered an “exceptional event” by EPA and these values are excluded from any required regulatory action.
Studies have also shown significant health impacts below the EPA standard as well. Therefore, the Agency has a health goal (of 25 micrograms per cubic meter), which was exceeded up to 12 days during wildfire and up to 3 days in winter months at individual sites.
Black Carbon
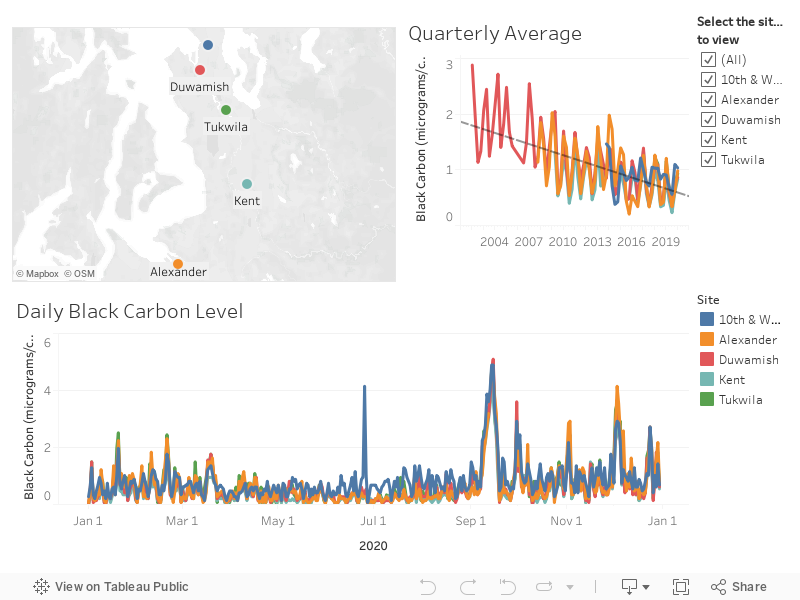
Fine particles that come specifically from diesel exhaust is our greatest concern as they carry the most health risks, but we can’t directly measure them and there is no EPA standard for them. Although not a perfect measurement, we use a “black carbon” monitor to estimate our impacts from diesel pollution. Diesel exhaust represents over 70% of the potential cancer risk from air pollution in the Puget Sound area. Most of the diesel exhaust in the Puget Sound region comes from four transportation sectors: maritime, off-road equipment, on-road vehicles, and rail. The graph below shows a reducing trend for black carbon since 2002. The levels have remained low in summer and higher in the winter when the air is typically more stagnant. The levels were highest during the wildfire smoke days in September at all sites.
Ozone (also called “smog”)
Unlike fine particles and black carbon, ozone (smog) is created on hot summer days by chemical reactions with different types of air pollution from vehicles, industry, paints, solvents, and gasoline fumes.
The graph shows that the ozone levels have been well within the EPA standard for the past few years. In 2020, we had another mild summer, which thankfully resulted in fairly low ozone levels again.

National and local air pollution reduction programs
Nationally, large reductions in diesel exhaust are expected to continue thanks to the newer diesel fuel and truck engine standards that took effect in 2007. The newer trucks are 50 to 60 times cleaner than the older, dirtier trucks. In 2011, an international agreement required incoming ships to use the cleanest shipping fuels along US coastlines (called an Emission Control Area) which also reduces diesel exhaust in our area. EPA continues to develop rules to reduce air toxics emitted from large and small industrial sources, which we ensure are implemented by the industries in our four counties through our compliance program.
Our Agency has also been working to further reduce air pollution on a local scale. With our Diesel Solutions program, we partner with private and government organizations to reduce diesel exhaust. Through our wood stove replacement program, and continuing to ensure wood heating burn ban compliance, we’ve seen levels of wood smoke come down in our region over the years. We continue to pursue other opportunities to lower air pollution in the region, including greenhouse gas reductions.
You can refer to the 2020 data summary and detailed report for more information.